

OCTOBER UPDATE | SEPTEMBER 2026 STATISTICS
More choice for buyers as the fall rebound stalls
Elevation Real Estate Group | RE/MAX Treeland Realty | October 5, 2026
The Fraser Valley remains a buyer's market heading into October. September brought more new listings, but the seasonal improvement in sales we anticipated did not arrive. Prices continued to soften, and the market has yet to show a sustained turn toward recovery.
Our outlook remains cautious: buyers generally have room to negotiate, sellers need to compete on today's value, and a meaningful rebound will require stronger demand. Langley townhouses continue to stand out, while September's apartment results show why one steady month is not enough to call a price bottom.
More listings, without a sales rebound
FVREB recorded 922 sales in September, down 2.0% from August and 4.2% from September 2025. New listings rose 18.8% from August to 2,818, although they remained 18.2% below a year earlier.
Active inventory barely changed at 9,763 listings, down 0.2% for the month and 7.7% annually. It is still 31% above the 10-year seasonal average. In our September update, we expected a modest sales pickup after summer holidays. The new numbers are weaker than that expectation: sellers returned more readily than buyers.
The longer-term supply picture is more encouraging. Year-to-date new listings are down 12.9%, compared with a 5.5% decline in sales. That may gradually help reduce excess inventory, but September's near-flat inventory shows that adjustment is not progressing smoothly.
Prices continue to adjust
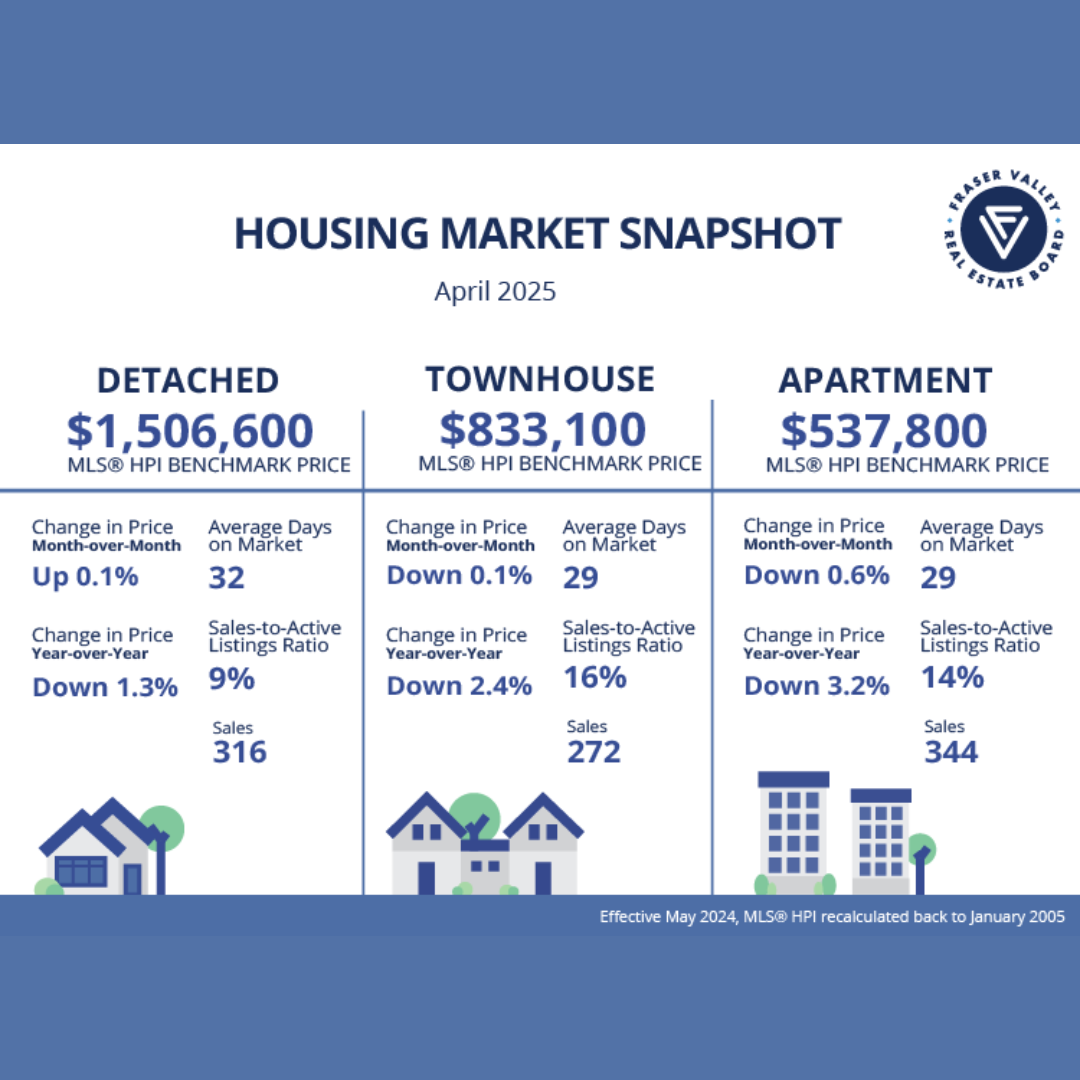
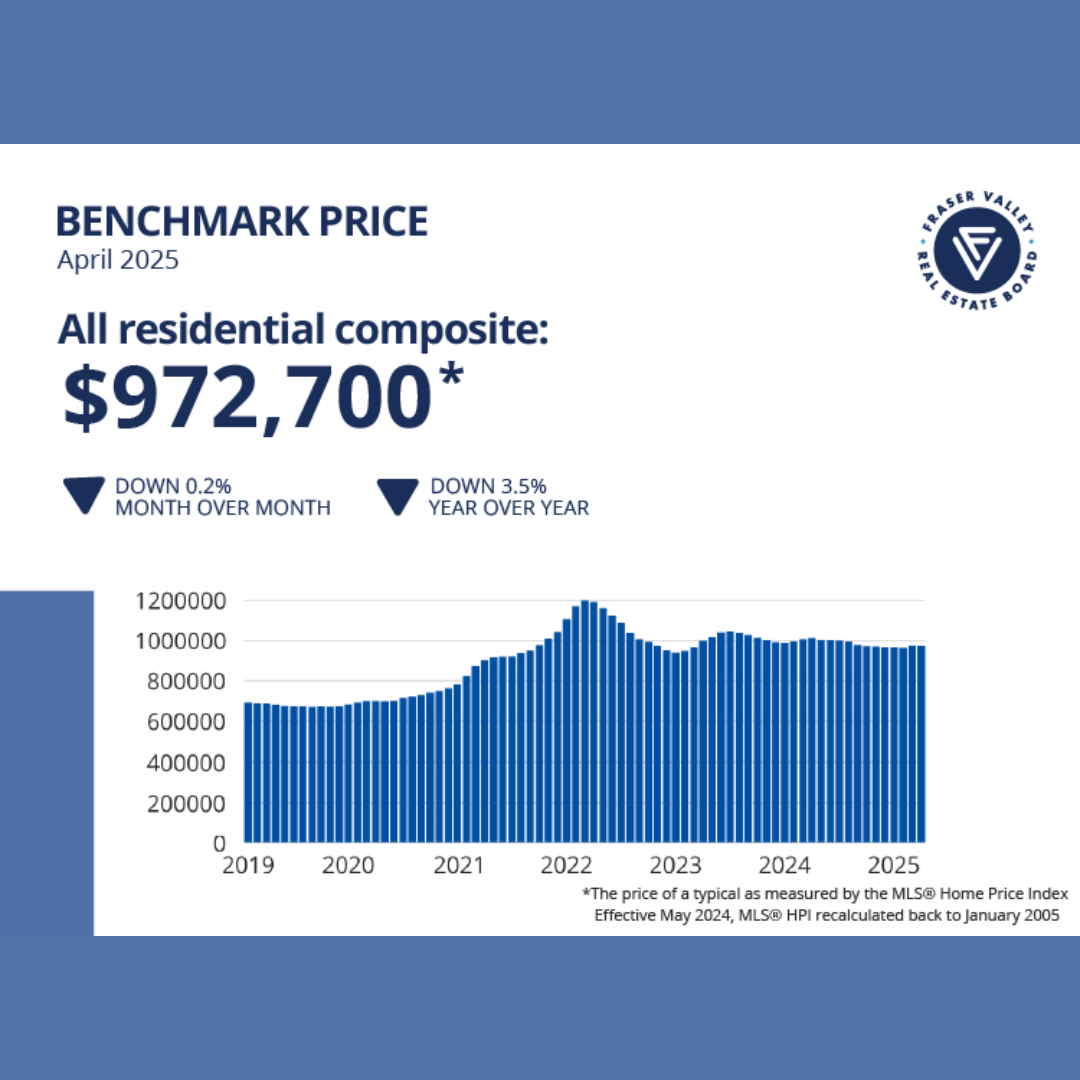
The composite benchmark fell 1.0% in September to $861,300, down 7.2% from a year earlier. All three main property types recorded monthly declines.

Detached homes had the largest monthly and three-month declines. Apartments remained the weakest category on an annual basis. Meanwhile, the overall average sale price rose 1.1% from August. That does not establish rising home values: averages change with the mix of properties sold, while benchmarks track homes with typical characteristics.
Sellers should weigh recent comparable sales alongside the properties buyers can choose from right now. An asking price supported by an older sale may still be uncompetitive today.
Langley remains stronger, with important differences
The regional sales-to-active listings ratio was 9.4%, calculated from all-property sales and month-end inventory. FVREB typically describes 12% to 20% as a balanced range. Comparisons within the same property type give a clearer local picture:

Townhouses: Langley's ratio remains above the usual balanced range, but eased from 23.3% in August. Sales were nearly unchanged while active listings rose 6.4%. Prices still declined, so the ratio points to relative strength rather than a market-wide return to bidding wars.
Apartments: Sales increased slightly from August and inventory was 29.4% below September 2025. Yet the benchmark fell 1.5% for the month and 9.2% annually. August's flat benchmark did not carry through into September. Better absorption and falling prices can coexist.
Detached homes: New listings rose 47.7% from August, active inventory increased 5.6%, and sales declined 7.2%. The benchmark's 0.6% monthly decline was smaller than the regional detached decline, but buyers gained more options.
Rates and the economy: do not assume relief is next
The Bank of Canada held its policy rate at 2.25% on September 2. Its next scheduled decision is October 28. The Bank highlighted increased inflation risks alongside uncertainty about growth.
BCREA's October 1 mortgage-rate forecast adds an important change in context. Its base case still holds the policy rate steady through year-end, but it warns that persistent inflation pressure could bring increases sooner than expected. It also says elevated bond yields, if sustained, could push five-year fixed mortgage rates above 5%. That is a conditional forecast, not a quote available to every borrower.
We would therefore build a moving plan around financing available today, with room for changes. Falling purchase prices do not automatically translate into lower monthly payments if mortgage rates rise. A rate hold also does not guarantee unchanged fixed mortgage pricing.
BCREA's August housing forecast projects provincial sales growth of 7.5% in 2027 after a 1.2% decline in 2026. That remains useful background, but it predates the October mortgage-rate outlook and is not a promise of a Fraser Valley rebound.
What we expect through the rest of the year
Our base case is continued buyer-friendly conditions and further uneven price softness through year-end. September gives us less reason to expect an early recovery. This is our assessment of current conditions, not a guaranteed forecast.
October: We will watch whether the new listings arriving in September attract more completed sales. A stronger month would be welcome, but one increase would not establish a lasting trend. Until demand improves relative to supply, we expect realistic pricing and negotiated offers to remain central to getting a sale completed.
November: We expect new listing activity to ease as the year winds down. Withdrawals and expiries could reduce inventory even if demand stays subdued. A higher sales-to-active ratio caused mainly by fewer listings would be a different signal from one driven by more buyers completing purchases.
December: We expect fewer transactions and more variation in monthly figures as activity slows. Motivated buyers and sellers can still reach workable agreements, but we would not count on a broad price rebound before year-end. Well-presented homes priced against current competition should be better positioned than listings relying on earlier market values.
We would become more optimistic if sales strengthened, inventory declined without sales weakening, and benchmark prices flattened over several months. Higher borrowing costs, weaker confidence or another rise in supply without matching sales would increase the risk of further price declines.
How to approach this market
Buying: Compare alternatives carefully, confirm your borrowing costs, and negotiate price, dates and appropriate conditions. Use the market's slower pace for inspections and document review. Desirable Langley townhouses may face more competition than the regional headline suggests.
Selling: Make your first weeks on the market count. Presentation and pricing should show buyers why your home is a strong choice among current listings. Review meaningful feedback and qualified offers promptly. Waiting for spring carries market risk and ongoing ownership costs.
Buying and selling: Focus on the full cost of the move, including the price difference, financing and transaction costs. A lower sale price can be partly or fully offset by savings on the next purchase, depending on the two properties and market segments.
If you are considering a move in Langley or elsewhere in the Fraser Valley, we can help you compare the recent sales, competing listings and financing considerations that matter for your plans. Contact our team for a closer look at your specific situation.
Source: Fraser Valley Real Estate Board, September 2026 statistics package, released October 5, 2026, PDF pages 2, 3, 4 and 6. Monthly figures are not seasonally adjusted. Regional totals include all property types; category comparisons cover detached homes, townhouses and apartments. Sales-to-active ratios are calculated from reported sales and month-end active listings and rounded to one decimal. A single month's ratio does not establish a price trend. Benchmark prices are not valuations of individual properties. Economic sources are linked above and reflect information available October 5, 2026. Read the full FVREB report.


 The data relating to real estate on this website comes in part from the MLS® Reciprocity program of either the Greater Vancouver REALTORS® (GVR), the Fraser Valley Real Estate Board (FVREB) or the Chilliwack and District Real Estate Board (CADREB). Real estate listings held by participating real estate firms are marked with the MLS® logo and detailed information about the listing includes the name of the listing agent. This representation is based in whole or part on data generated by either the GVR, the FVREB or the CADREB which assumes no responsibility for its accuracy. The materials contained on this page may not be reproduced without the express written consent of either the GVR, the FVREB or the CADREB.